Restaurant analytics that show what makes you money

Your POS knows sales. Your scheduler knows hours. Your booking system knows covers. Munu is where they finally meet. One live view, per venue, per shift.

Book a demo
80+
Active analytics customers
Restaurants, hotels, and festivals using Munu Analytics daily across the Nordics.
15%
Average check uplift reported
Menu insights reveal top performers and hidden margin, lifting average spend per guest.
3–5%
Gross margin improvement
Labour and inventory analytics cut waste and overstaffing, protecting your bottom line.

Customers live on analytics

Munu and Thon Hotels

Your POS, bookings, labour, and inventory - unified in one live view.

Stop guessing. Start running your restaurant on facts.

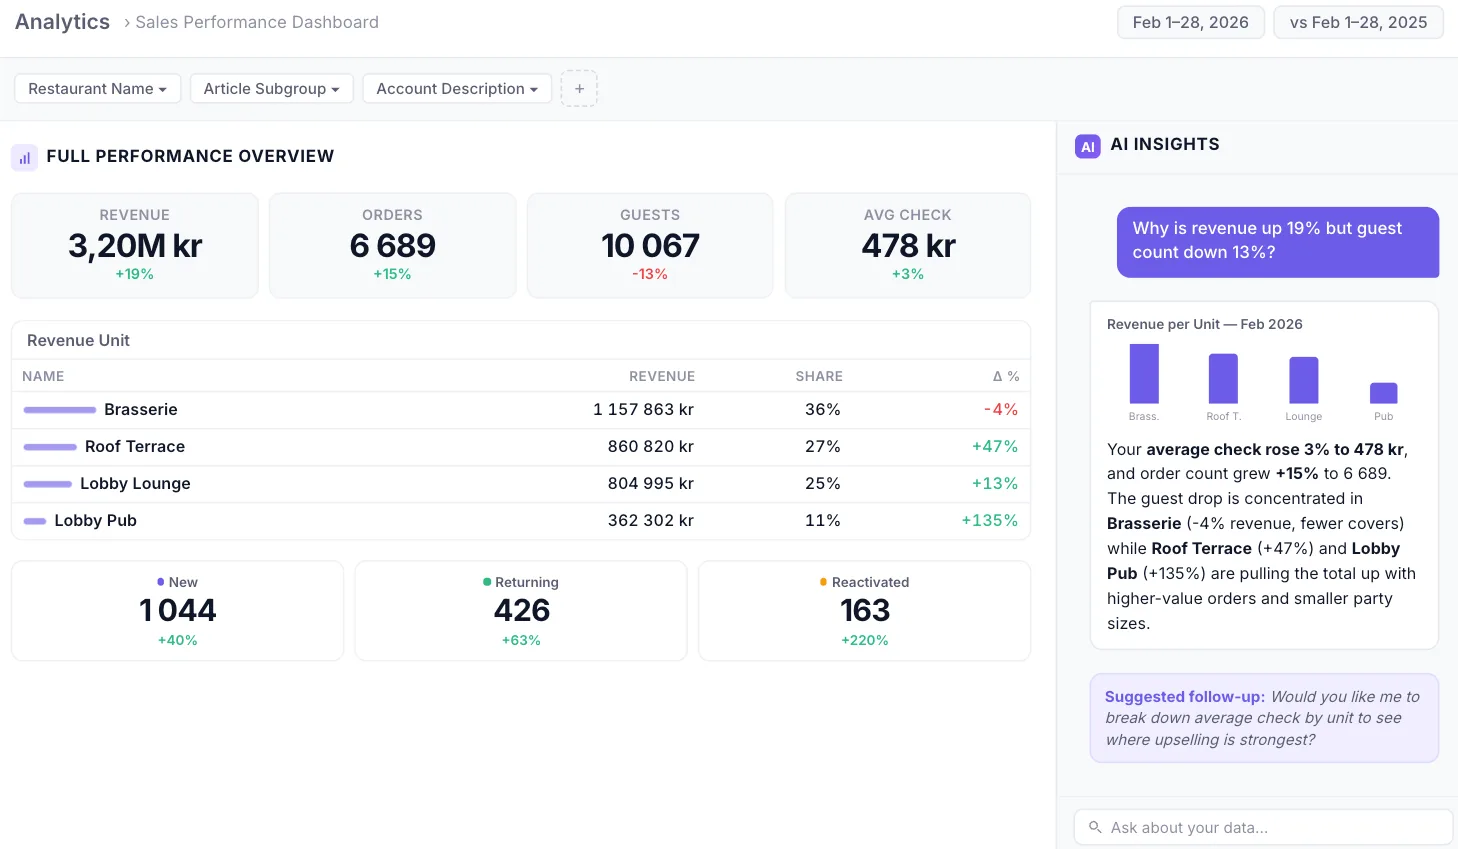
› Sales Performance Dashboard
Feb 1–28, 2026
vs Feb 1–28, 2025
Restaurant Name ▾
Article Subgroup ▾
Account Description ▾
+
Full Performance Overview
Revenue
3,20M kr
+19%
Orders
6 689
+15%
Guests
10 067
-13%
Avg Check
478 kr
+3%
Revenue Unit
NameRevenueShareΔ %
Brasserie
1 157 863 kr36%-4%
Roof Terrace
860 820 kr27%+47%
Lobby Lounge
804 995 kr25%+13%
Lobby Pub
362 302 kr11%+135%
New
1 044
+40%
Returning
426
+63%
Reactivated
163
+220%
AI
AI Insights
Why is revenue up 19% but guest count down 13%?
Revenue per Unit — Feb 2026
Brass.
Roof T.
Lounge
Pub
Your average check rose 3% to 478 kr, and order count grew +15% to 6 689. The guest drop is concentrated in Brasserie (-4% revenue, fewer covers) while Roof Terrace (+47%) and Lobby Pub (+135%) are pulling the total up with higher-value orders and smaller party sizes.
Suggested follow-up: Would you like me to break down average check by unit to see where upselling is strongest?
Ask about your data...

What is inside

Five modules. One
connected platform.

Sales Performance

Your full revenue picture, updated in real time

Track revenue, covers, and order volumes by hour, day, meal period, and outlet. Spot trends before they become problems, and replicate what works before it fades.

  • Revenue against target, daily, weekly and monthly
  • Hourly and meal period breakdown
  • Average check per order and per guest
  • Sales by category: food, drink, wine, coffee
  • Day of week patterns to guide planning
  • Multi outlet comparison in one view
Today's sales overview
Revenue today84 200 kr
Avg check per guest↑ 245 kr
Covers served342
vs last Tuesday↑ 12 %
Menu Engineering

Know what to sell, what to cut, what to reprice

The Boston Matrix view maps every item by popularity and profitability, so menu decisions come from data rather than instinct. Find your hidden margin before the next menu change.

  • Boston Matrix: popularity against profitability per item
  • Top and bottom sellers by revenue and volume
  • Contribution margin per dish
  • Items missing cost data, flagged as data quality alerts
  • Category mix, share of orders per group
  • Average spend per item to guide pricing
Item performance matrix Popularity →Margin
Ribeye, Star68 %
Salmon, Workhorse41 %
Truffle pasta, Challenge58 %
Seafood platter, Dog28 %
Employee Insights

Coach your team with data, not guesswork

See how each team member performs on upselling, average check, and items per order. Use it to recognise your strongest people and support the ones who need it, with facts rather than feelings.

  • Average check per guest by employee
  • Items per order, showing upselling effectiveness
  • Tips by employee for earnings transparency
  • Team benchmark, individual against group average
  • Discount usage per employee
  • Performance trends over time
Team upselling performance
Anna K.312 kr
Erik M.284 kr
Team average245 kr
Jonas T.198 kr
New: Workforce Management

Every labour hour, priced against what it earned

Workforce management hours meet POS revenue in one view. Sales per labour hour, labour cost percentage, and the split between productive and non productive time, per venue, per weekday, per shift.

  • Sales per labour hour, by venue and by weekday
  • Labour cost as a share of revenue, tracked continuously
  • Non productive time made visible instead of buried in the total
  • Hours flow in from workforce management, never re entered by hand
  • Hourly demand patterns to guide scheduling
  • Busy and quiet periods identified across the week
Labour against revenue, last week
Sales per labour hour
1 212 kr
Labour cost
26,3 %
Non productive
13,5 %
Top weekdays by revenue
Weekday Revenue Hours Labour
Sunday 799 330 kr 538,9 20,9 %
Saturday 718 912 kr 643,3 27,2 %
Monday 388 133 kr 371,0 32,2 %
Booking Analytics

Turn reservations into revenue intelligence

Combine POS and booking data for insights no standalone system can give you. Understand your guests: who is coming back, who is not, and what they spend when they do.

  • No show and cancellation rates
  • New, returning and regular guest tracking
  • Average meal duration to optimise table turns
  • Party size breakdown: solo, couple, group, large
  • Revenue per booking by guest segment
  • Combined POS and booking view in one dashboard
Guest intelligence this month
Returning guests62 %
No show rate8 %
Avg meal duration52 min
Groups of 4 or more38 %
✦ New: Ask Your Data

Just ask. Get answers grounded in your actual numbers.

No SQL. No dashboards. No waiting for a report. Type a question in plain language and get an instant answer pulled from your live Munu data, with a link back to the full dashboard so you can always verify.

  • Plain language questions, such as "What was my best day last month?"
  • Answers grounded in your real data
  • Every answer links back to the live dashboard to verify
  • Instant reports to share with your team or owners
  • Ask about any module: sales, menu, staff, labour, bookings
  • Works across single venues and multi site groups
Munu AI, live example
What were my top 3 items by margin last week?
✦ Munu AI Your top 3 items by gross margin last week were:

1. Ribeye, 68 % margin (142 orders)
2. Truffle pasta, 58 % margin (89 orders)
3. Burrata starter, 74 % margin (201 orders)
↗ View in Menu Engineering dashboard
Which weekday had the worst labour cost?
✦ Munu AI Monday, at 32,2 % labour cost on 388 133 kr revenue and 371 hours. Sunday earned more on fewer hours, at 20,9 %.
↗ View in Workforce Management dashboard
Munu Analytics — The Business Case

The business case

What Munu Analytics customers typically see

15

Average check improvement

By tracking upselling effectiveness per employee and identifying which categories drive higher order values — starters, wine pairings, desserts.

Based on active customer outcomes

3–5

Gross margin improvement

By identifying underperforming menu items and pricing opportunities through the Boston Matrix view — without guessing.

Based on active customer outcomes
4

Back-office time saved per week

Stop exporting spreadsheets. Stop building manual reports. Your data is live, structured, and always ready.

Reported by customers within 30 days

<1

Time to first actionable insight

Once connected to your Munu POS, dashboards populate quickly and your team can start making data-driven decisions within the first week.

Typical onboarding timeline

Customer stories

Real results from real operators

Olarsgården Hotel and Restaurang team in Sälen Hotel & Restaurant Sälen, Sweden

Olarsgården Hotel & Restaurang

"I feel I'm on the right path and with Munu's support it will be possible to succeed."

Jonas, CEO & Owner

+14% Average check per guest
+38% Items per order
1 mo Time to results
Read the full story
Hekkan Burger Bergen team preparing food Quick Service Bergen, Norway

Hekkan Burger, Bergen

"Staff could see their efforts paying off while managers gained confidence in how data can be used to drive behavior, not just report on it."

Driving growth through data

+13% Average payment size
+56 kr Per guest uplift
27K Extra beverage revenue (NOK)
Read the full story
Son Spa waterfront hotel view Hotel & Spa Son, Norway

Son Spa

"Great to see the changes we made this summer had an impact."

Ann Jeanette, General Manager

+25% Starter & snack sales
+44% Returning customers
35K Web-shop revenue (NOK)
Read the full story

Built for every format

Analytics that fits how you operate

Run your restaurant on facts, not gut feel

You are on the floor all day and in a spreadsheet all night. Munu Analytics gives independent operators a live overview of what is selling, what is not, and what is quietly eating into your margin.

  • See today's revenue, margin, and top sellers from your phone
  • Identify which menu items are dragging down gross margin
  • Track average check per employee for upselling coaching
  • Plan staff shifts based on actual hourly demand patterns
  • Spot slow periods before they become a pattern
Performance at a glance
Revenue vs target92%
Gross margin68%
Items profitable74%
Staff cost ratio28%

See across every outlet, in one view

Managing multiple venues means you are always one step behind the data. Munu Analytics consolidates performance across your entire group so you can benchmark, replicate what works, and fix what does not.

  • Compare revenue, labour, and margin across all locations
  • Filter by day, region, or concept to isolate what is working
  • Replicate top performers — data-led, not guesswork
  • Group-level reporting ready for management meetings
  • Centralised overview with per-outlet drill-down
Outlet benchmarking
Oslo — Aker Brygge95%
Bergen — Bryggen78%
Stavanger — City61%
Trondheim — Midtbyen84%

F&B profitability, finally visible

Hotel F&B is complex — multiple outlets, room charges, events, and seasonal swings. Munu Analytics gives you total F&B visibility across your property, integrated directly with your PMS.

  • Unified view across restaurant, bar, room service, and events
  • Track F&B contribution to total property revenue
  • PMS-integrated reporting — no manual reconciliation
  • Labour and margin insights by outlet and daypart
  • Booking analytics: no-show rate, new vs returning guests
  • Average meal duration and party size — optimise table turns
F&B revenue breakdown
Restaurant82%
Bar & lounge55%
Room service38%
Events & banquets71%
New Feature

Ask your data anything.
Get answers in seconds.

Most operators spend hours chasing numbers across spreadsheets and reports. With the AI function, you type a question in plain language and get an instant answer pulled directly from your live restaurant data — sales, staff, menu, bookings, all of it.

Every answer links back to the live dashboard so you can always see where the number came from. No black box. No waiting. Just answers.

"What was my best Saturday in Q1?"
"Which menu items are hurting my margin?"
"Who is my top upseller this month?"
"How did last week compare to the same week last year?"
AnalyticsAI · Your restaurant data
How did dinner revenue perform vs last week across all outlets?
✦ Analytics AI Dinner revenue this week was 1.24M kr across all outlets — up +14% vs last week.

Top performer: Oslo Aker Brygge (+22%)
Needs attention: Bergen Bryggen (-4%) ↗ Open in Sales Performance dashboard
Why is Bergen down?
✦ Analytics AI Bergen shows lower covers (-18 guests) and a drop in wine category sales (-31%). Average check is steady at 348 kr — the issue is traffic, not spend per guest. ↗ View Bergen in Menu Engineering
Ask anything about your data...

What operators are saying

Real results from real restaurants

It lets us track top-selling items, measure menu engineering decisions, and follow up on actions with granular KPIs. The real value is having all that data in one place with dynamic filters.

Better access gives more knowledge on own data — no assumptions anymore.

Strong benefit in quickly visualizing data for owners, planning staff shifts, and tracking item/category performance without manual Excel work.

This is definitely what we need. It finally gives us control.

On-demand recording

Get more from
Munu Analytics

A 30-minute session covering real-time dashboards, upselling tracking, cost analysis, and how to set actionable targets for your team. Recorded live, built around real questions from hospitality operators like you.

Recorded 8 May 2026
30 min

Speakers

A
Amina Hamade Analytics Product Manager, Munu
O
Olle Friberg Operations Manager (Central), Fursetgruppen
G
Gianmaria Pisapia GM, Lofoten Fiskerestaurant (Fursetgruppen)
K
Konstantin Yordanov F&B Manager, Clarion Hotel The Hub
J
Jonas Persson Owner, Olarsgården Hotell & Restaurang
Access the webinar recording
Pricing

One analytics add-on. Everything you need.

No tiers. No hidden fees. Munu Analytics is a single add-on to your existing Munu POS subscription.

Munu Analytics
Book a demo for pricing
Pricing is based on your setup. We will walk you through the numbers for your venue or group.
  • Real-time sales and revenue dashboards
  • Employee performance tracking
  • Gross margin and menu engineering
  • Labour cost and staffing insights Available Now
  • Booking analytics (POS + Booking)
  • Multi-outlet comparison
  • AI Chat — ask your data New Feature
Book a demo
F
S
C
N
80+
80+ active customers Fursetgruppen, Strawberry, Thon, and more
Requires Munu POS
GDPR compliant
Nordic cloud hosting

All-in-one tools to
power your business

Munu provides everything you need to run a seamless operation—no extra hassle.

Munu Analytics. Frequently asked questions for restaurants, hotel groups and bar operators in the Nordics

How does Munu Analytics work, and what makes it different from typical restaurant dashboards?
Munu Analytics connects data from POS, Booking, Payments and Inventory in near real time, then turns it into operational insights. Instead of exporting spreadsheets and building manual reports, you get one view of revenue drivers, margin performance and guest behaviour, so teams can act faster across Norway, Sweden, Denmark and Finland.
What data sources and integrations can I connect inside Munu Analytics?
You can connect sales, bookings, payment and inventory data directly from Munu. You can also extend reporting with relevant third party integrations such as accounting, delivery platforms and staffing tools, so you build one consistent source of truth across venues and concepts.
Can Munu Analytics help me identify regular guests and how often they return?
Yes. Munu Analytics can group guests into new, returning and reactivated segments by combining booking and payment patterns. That makes it easier to measure loyalty and campaign impact, even without running a dedicated loyalty program.
How do I see which menu items perform best, and which ones hurt my margins?
Munu Analytics includes Menu Insights that maps items by popularity and profitability, often using a Boston Matrix style view. This helps you spot bestsellers, underperformers and pricing opportunities, so you can improve gross margin without guessing.
How can Munu Analytics compare performance across multiple restaurant locations?
Multi site benchmarking lets you compare key metrics such as sales, labour, guest visits and profitability across outlets. You can filter by day, concept or region to identify what is working, then replicate those patterns across the group.
Is Munu Analytics GDPR compliant, and how is access to data controlled?
Munu Analytics is designed for GDPR compliant operations and secure hosting in Nordic cloud infrastructure. Access is role based, so finance, marketing and operations teams see only the data that is relevant to their responsibilities.
How fast can I start seeing insights after activating Munu Analytics?
If you already use Munu POS and Munu Booking, onboarding is typically quick. Once connected, dashboards begin populating immediately, so you can start seeing initial insights within hours in many setups.