15
Average check improvement
By tracking upselling effectiveness per employee and identifying which categories drive higher order values — starters, wine pairings, desserts.
Based on active customer outcomes
Munu Analytics unifies your POS, bookings, labour, and inventory in one live view. Stop guessing. Start running your restaurant on facts.
Book a demoA 30-minute session covering real-time dashboards, upselling tracking, cost analysis, and how to set actionable targets for your team. Recorded live, built around real questions from hospitality operators like you.
Speakers


Stop guessing. Start running your restaurant on facts.
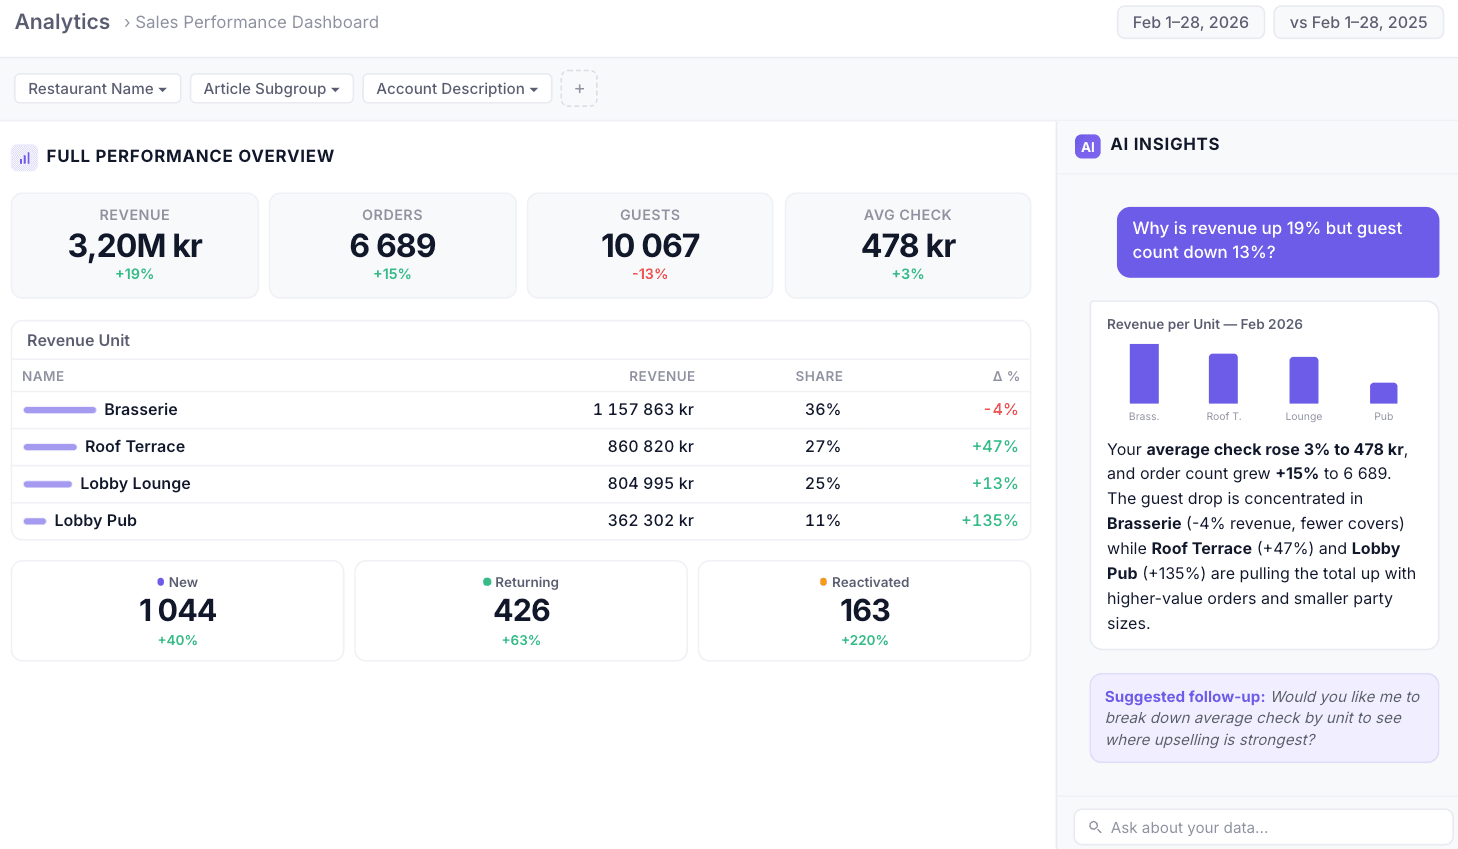
| Name | Revenue | Share | Δ % |
|---|---|---|---|
| 1 157 863 kr | 36% | -4% | |
| 860 820 kr | 27% | +47% | |
| 804 995 kr | 25% | +13% | |
| 362 302 kr | 11% | +135% |
What's inside
Track revenue, covers, and order volumes by hour, day, meal period, and outlet. Spot trends before they become problems — and replicate what works before it fades.
See how each team member is performing on upselling, average check, and items per order. Use it to recognise your top performers and support those who need it — with facts, not feelings.
Match your staffing to actual demand patterns — by hour, day, and season. Track labour cost as a percentage of revenue and know immediately when you're over or under-resourced.
Combine your POS and booking data for insights no standalone system can give you. Understand your guests — who's coming back, who isn't, and what they're spending when they do.
No SQL. No dashboards. No waiting for a report. Type a question in plain language and get an instant, accurate answer pulled directly from your live Munu data — with a link back to the full dashboard so you can always verify.
The business case
By tracking upselling effectiveness per employee and identifying which categories drive higher order values — starters, wine pairings, desserts.
Based on active customer outcomes
By identifying underperforming menu items and pricing opportunities through the Boston Matrix view — without guessing.
Based on active customer outcomes
Stop exporting spreadsheets. Stop building manual reports. Your data is live, structured, and always ready.
Reported by customers within 30 days
Once connected to your Munu POS, dashboards populate quickly and your team can start making data-driven decisions within the first week.
Typical onboarding timeline
Real results from real operators
Hotel & Spa Norefjell, Norway
Norefjell Ski & Spa
"The same data discipline that drove the upselling results this winter is now being pointed at the cost base."
Data-driven F&B strategy across five outlets
Read the full storyRecord Highest avg check on record~28.5% Revenue growth from higher spend5 F&B outlets connectedHotel & Restaurant Sälen, Sweden
Olarsgården Hotel & Restaurang
"I feel I'm on the right path and with Munu's support it will be possible to succeed."
Jonas, CEO & Owner
Read the full story+14% Average check per guest+38% Items per order1 mo Time to resultsQuick Service Bergen, Norway
Hekkan Burger, Bergen
"Staff could see their efforts paying off while managers gained confidence in how data can be used to drive behavior, not just report on it."
Driving growth through data
Read the full story+13% Average payment size+56 kr Per guest uplift27K Extra beverage revenue (NOK)Hotel & Spa Son, Norway
Son Spa
"Great to see the changes we made this summer had an impact."
Ann Jeanette, General Manager
Read the full story+25% Starter & snack sales+44% Returning customers35K Web-shop revenue (NOK)
Built for every format
You are on the floor all day and in a spreadsheet all night. Munu Analytics gives independent operators a live overview of what is selling, what is not, and what is quietly eating into your margin.
Managing multiple venues means you are always one step behind the data. Munu Analytics consolidates performance across your entire group so you can benchmark, replicate what works, and fix what does not.
Hotel F&B is complex — multiple outlets, room charges, events, and seasonal swings. Munu Analytics gives you total F&B visibility across your property, integrated directly with your PMS.
Most operators spend hours chasing numbers across spreadsheets and reports. With Munu AI, you type a question in plain language and get an instant answer pulled directly from your live restaurant data — sales, staff, menu, bookings, all of it.
Every answer links back to the live dashboard so you can always see where the number came from. No black box. No waiting. Just answers.
What operators are saying
It lets us track top-selling items, measure menu engineering decisions, and follow up on actions with granular KPIs. The real value is having all that data in one place with dynamic filters.
Better access gives more knowledge on own data — no assumptions anymore.
Strong benefit in quickly visualizing data for owners, planning staff shifts, and tracking item/category performance without manual Excel work.
This is definitely what we need. It finally gives us control.
No tiers. No hidden fees. Munu Analytics is a single add-on to your existing Munu POS subscription.
Munu provides everything you need to run a seamless operation—no extra hassle.
Newsletter subscription